Table of contents
Framework Overview
Information regarding use of the DIRAC Framework to build new components
Static Component Monitoring
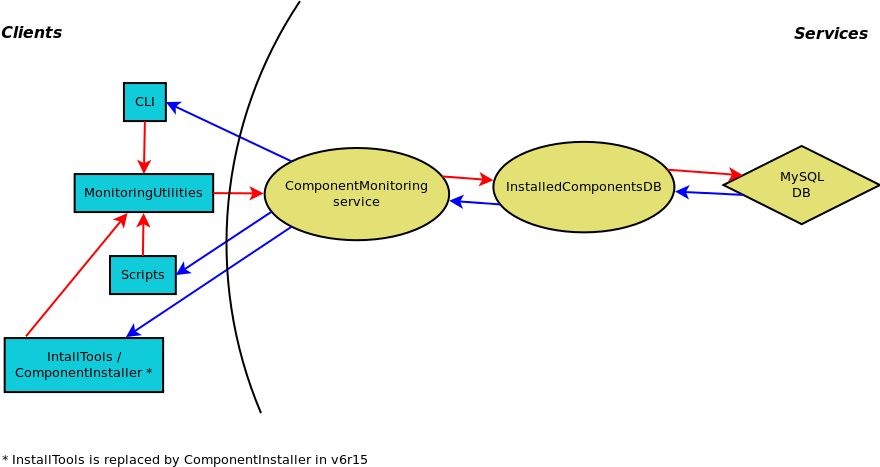
The Component Monitoring system takes care of logging information about the components that have been installed and uninstalled in different hosts, like the date or author of the change. The following figure illustrates how different components from this system communicate with each other:
All of the static information is stored in a MySQL database, InstalledComponentsDB. This database contains 3 tables, as illustrated below:
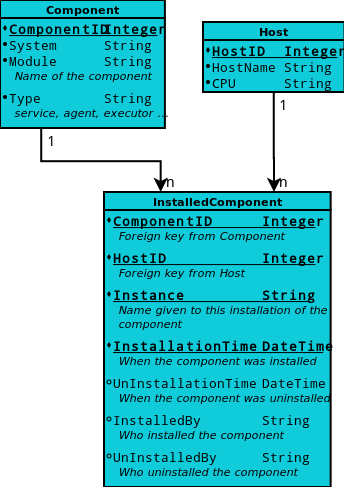
The InstalledComponentsDB.py file in the Framework system defines all the tables and their relationships using SQLAlchemy, as well as functions to access and modify the values in the database. The following code shows the definition of the ‘Component’ class:
class Component( Base ):
  __tablename__ = 'Components'
  __table_args__ = {
    'mysql_engine': 'InnoDB',
    'mysql_charset': 'utf8'
  }

  componentID = Column( 'ComponentID', Integer, primary_key = True )
  system = Column( 'System', String( 32 ), nullable = False )
  module = Column( 'Module', String( 32 ), nullable = False )
  cType = Column( 'Type', String( 32 ), nullable = False )

  def __init__( self, system = null(), module = null(), cType = null() ):
    self.system = system
    self.module = module
    self.cType = cType
    self.installationList = []
As can be seen, it is fairly easy to define a new class/table. The only thing that might seem off is the self.installationList field, as it has not been ‘declared’ before. This field acts as a back reference for the InstalledComponent table ( it is a list of all the installations the component is associated to, i.e., a list of InstalledComponent objects ). This reference is completed in the InstalledComponent class definition with the addition of the ‘installationComponent’ field:
class InstalledComponent( Base ):
  """
  This class defines the schema of the InstalledComponents table in the
  InstalledComponentsDB database
  """

  __tablename__ = 'InstalledComponents'
  __table_args__ = {
    'mysql_engine': 'InnoDB',
    'mysql_charset': 'utf8'
  }

  componentID = Column( 'ComponentID',
                        Integer,
                        ForeignKey( 'Components.ComponentID' ),
                        primary_key = True )
  hostID = Column( 'HostID',
                    Integer,
                    ForeignKey( 'Hosts.HostID' ),
                    primary_key = True )
  instance = Column( 'Instance',
                      String( 32 ),
                      primary_key = True )
  installationTime = Column( 'InstallationTime',
                              DateTime,
                              primary_key = True )
  unInstallationTime = Column( 'UnInstallationTime',
                                DateTime )
  installedBy = Column( 'InstalledBy', String( 32 ) )
  unInstalledBy = Column( 'UnInstalledBy', String( 32 ) )
  installationComponent = relationship( 'Component',
                                        backref = 'installationList' )
Although we are using MySQL here, it is possible to switch to other SQLAlchemy-supported databases by changing the URI of the database in the initialization methods to point to the one being used instead.
For instance, from:
self.engine = create_engine( 'mysql://%s:%s@%s:%s/%s' %
                 ( self.user, self.password, self.host, self.port, self.db ),
                 pool_recycle = 3600, echo_pool = True
                 )
to:
engine = create_engine( 'sqlite:////route/to/my/db.db' , pool_recycle = 3600, echo_pool = True, echo = True )
The ComponentMonitoring service acts as an interface between the client side and the functionalities provided by InstalledComponentsDB ( accessing and modifying the database ). Clients to this service are created to modify the database or access its data. The MonitoringUtilities module provides the functionality needed to store or delete monitoring entries from the database:
from DIRAC.FrameworkSystem.Utilities import MonitoringUtilities

# Add an entry to the DB for the SysAdmin service
result = MonitoringUtilities.monitorInstallation( 'service', 'Framework', 'SystemAdministrator' )
if not result[ 'OK' ]:
  print 'Something went wrong'
gMonitor object Internals
This part covers the internal workings of the gMonitor object. gMonitor is a singleton object meaning its instance is only created once from the MonitoringClient and is used throughout in other systems for monitoring the component details like CPU, MEM, threads, etc.
Client - Server interactions of the gMonitor object (basic overview diagram):
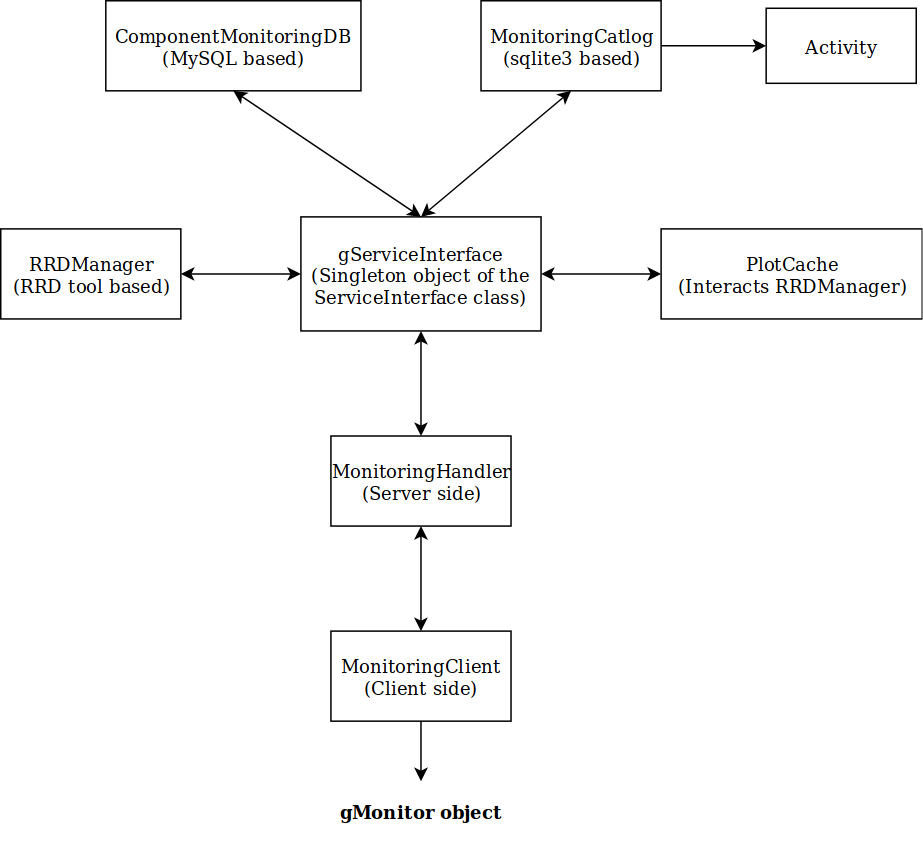
1) MonitoringClient (inherited by gMonitor singleton object): This class is inherited by the gMonitor object and is used for reporting all types of components Activities. Basically, from here all the information is sent to the MonitoringHandler(server side) using methods like registerActivity and addMark and all the data is flushed periodicaly by the object gMonitoringFlusher every 300 seconds.
2) MonitoringHandler: This class is inherited from the RequestHandler class which is the base required for running any kind of services in DIRAC. This class is basically used to expose methods inside ServiceInterface which is accessed with the help of the gServiceInterface (singleton object) and before exposing the methods there are some filters applied like not including invalid actions, decoding view descriptions, etc. Here the methods called inside export_ methods will be explained in depth inside the ServiceInterface part.
3) ServiceInterface (inherited by the gServiceInterface singleton object): This is the place where all the activity data is received from the gMonitor object and from here the other the internal interactions of the Framework/MonitoringHandler happens with components like RRDManager used for reporting data to the rrdtool which is based on command line used for generating plots, the ComponentMonitoringDB which is used to store the basic component information like component type, component name, number of queries performed, etc and the MonitoringCatalog which is used to store all the activity data inside the sqlite3 database which is lastly referred by the rrdtool and the Web interface i.e. the ActivityMonitor part.
4) RRDManager (wrapper around the rrdtool): This is class is called by the ServiceInterface This class is a wrap around the rrdtool as it is a command line based tool within this class there are several methods which take in some parameters required by the corresponding rrd command and executes it.
5) MonitoringCatalog (based on sqlite3): Here all the information about the activity of the components is maintained like which rrd file to refer for what components then other details like CPU, MEM, Queries, etc. is stored here.
6) ComponentMonitoringDB (based on MySQL): This database basically stores the basic information of the components not the activity data like Type, ComponentName, Port, Host, etc and this all is stored under the compmon_Components table inside this database. The other info like version history of the components like VersionTimestamp, DIRACVersion, etc. is stored under compmon_VersionHistory table of the database.
7) PlotCache This is basically used to cache the graphs that are generated once so if the user tries to generate them again the entire process of graph generation using RRDManager is not performed instead a cached version of the graph is returned to reduce the response time.
This was just an overview of the components that gMonitor object interacts with more detail can be found inside the code of that particular component. The use cases of gMonitor object can be found inside the DIRAC/Core/DISET/private/Service.py, DIRAC/Core/Base/AgentModule.py, Transformation System, etc.
Dynamic Component Monitoring
This system takes care of managing monitoring information of DIRAC component. It is based on ElasticSearch database. It is based on MonitoringSystem. The information is collected by the __storeProfiling periodic task on the SystemAdministartor. The task is disabled by default. The MonitoringReporter is used to propagate the DB whith the collected values.